Data Center Grid Connection and Power Quality
AI data centers must manage rapid changes in electricity demand while maintaining reliable power inside the facility. Their electrical design must address grid connection requirements, equipment behavior during disturbances and internal power quality. This guide uses Finnish specification for demand loads (KJV2026) and a 100 MW example facility to explain data center grid connection studies and compensation sizing including STATCOM, E-STATCOM and BESS. It then examines internal harmonics and active harmonic filter AHF selection.
Executive summary
AI data centers are electrical loads that the grid has never seen before, and they place demanding requirements on electrical infrastructure. Developers should define the facility’s grid connection and power quality needs early, then select equipment that can demonstrate the required performance.
The electrical design must address five main requirements:
- Control reactive power. Keep reactive power import and export within the connection limits as facility demand changes and help provide reactive power in low voltage ride through situations. STATCOM provides fast compensation and voltage support.
- Manage rapid changes and repeated power fluctuations. Assess how much the UPS systems or PTUs and load controls can smooth demand. Where additional support is needed, specify E-STATCOM or BESS with sufficiently fast measurement, communication and converter control.
- Withstand disturbances and restore demand after faults. Coordinate UPS behavior, protection and plant controls so the facility stays connected through the specified disturbances and grid demand recovers as required. BESS charging can support recovery where the facility’s own demand returns too slowly.
- Provide controlled demand reduction. The facility must be able to reduce grid consumption when instructed. Coordinate load reduction, BESS and backup generators, sizing stored energy for the required operating duration.
- Filter internal network harmonics to comply with standards. Use local Active Harmonic Filters (AHFs) to maintain current and voltage distortion within acceptable limits where needed. Sizing should be checked for different internal network modes and changing fault level – normal operation, UPS bypass and generator supply.
Data center developers and contractors should choose a supplier that can demonstrate the required performance. Require equipment-specific simulation models, relevant network-operator experience and support through commissioning. Modular equipment should accommodate phased construction. Merus Power supports this process through electrical studies, equipment models, compensation systems and energy storage solutions.
The content of this guide is accessible also as webinar recording.
Data Center Electrical Architecture
Data center power quality must be managed both at the grid connection and inside the facility. STATCOM, E-STATCOM and BESS support reactive power control and, where energy storage is included, active power management at the grid connection. Within the facility, active harmonic filters (AHF) reduce harmonic currents close to the loads that produce them. The figure below shows where these solutions fit into a typical electrical architecture:
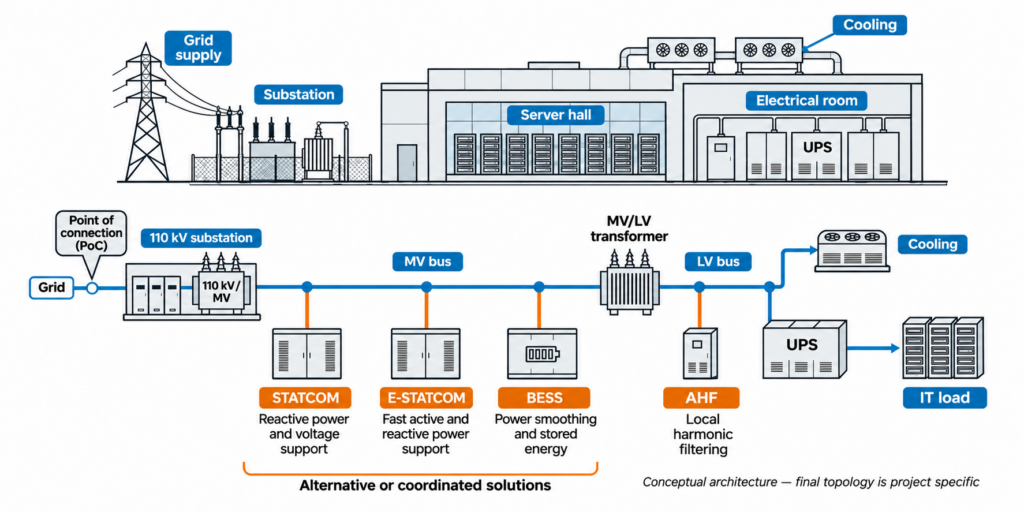
Figure 1. Solution locations across the facility’s electrical architecture. STATCOM, E-STATCOM and BESS connect through the medium voltage network or alternatively to high voltage, depending on the scheme to support the point of connection (PoC). AHF connects locally to low voltage buses.
Part 1: Data Center Grid Connection
Grid connection requirements and KJV2026
The requirements for demand connections in Finland are defined by the local TSO, Fingrid, in KJV document (fin. Kulutuksen Järjestelmätekniset Vaatimukset). KJV2026 is specific to Finland, but the engineering questions are relevant internationally: how a large load responds to disturbances, changes its demand and affects other grid users. KJV2026 update especially addresses the growing number of large electricity consumers and their effect on grid stability.
The KJV requirements are intended to ensure that:
- Electrical equipment withstands the specified voltage and frequency changes.
- Facilities stay connected during the voltage and frequency disturbances covered by the requirements.
- A connected facility does not cause harmful disturbances in other installations on the power system.
- Fingrid and the network operator receive the equipment data needed to plan and operate the power system securely.
The most demanding new rules concern Type D facilities with a rated demand of at least 30 MW. As of 11 November 2026, KJV2026 remains a draft. Public consultation ended in August 2026, and Fingrid targets confirmation in March 2027. Separate technical requirements published on 12 June 2026 already apply to large direct Fingrid connections. They do not apply to distribution grid connected facilities, but once the KJV2026 has been confirmed by the Finnish Energy Authority, the KJV2026 requirements will be applied to them as well.
The KJV process and project timeline
Approved grid connection takes planning and time. Grid studies, equipment models and technical reviews need time alongside construction. Starting the KJV work about 15–18 months before planned operation is a useful planning allowance, as Figure 2 illustrates. This is not a fixed approval period: the schedule depends on the studies and any design changes they identify. The process has four main phases.
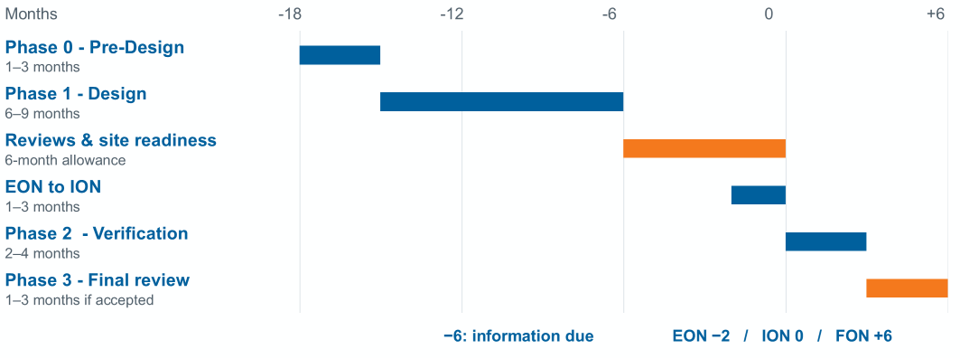
Figure 2. Illustrative connection and verification timeline. Month 0 represents the start of interim operation. Engineering durations and the suggested 15–18 month preparation period are planning assumptions, not approval guarantees or Fingrid service commitments.
Phase 0 Pre-design
The developer and network operator establish the facility’s technical data and design principles, including its demand profile, connection arrangement and main equipment. This is also the stage to identify any special studies, so that their results can influence equipment choices before procurement.
Phase 1 Design
The detailed design and simulation models provide the evidence needed for permission to energise the connection and begin interim operation. The Energisation Operational Notification (EON) permits energisation; the Interim Operational Notification (ION) permits interim operation while the remaining verification work is completed.
Phase 2 Commissioning and verification
Commissioning testing must verify both the grid connection and the demand facility. The results are used to confirm compliance and update the simulation models. Under the draft, the initial ION period is up to 12 months, and the verification work must be completed while it is valid. An extension requires approval.
Phase 3 Review and approval
The network operator reviews the completed evidence and issues the Final Operational Notification (FON) once the connection and demand facility have met the requirements. This closes the verification process and permits continued operation.
Simulation models and equipment procurement
For a large demand facility such as a data center, KJV2026 requires simulation models to demonstrate how the facility behaves electrically which makes model availability part of equipment procurement. Project developers should specify the required PSS®E and PSCAD models when ordering UPS systems, converters and compensation equipment, rather than discovering later that a selected device cannot be represented accurately.
Fingrid’s PSCAD instructions require manufacturer-specific models for UPS systems, dynamic reactive compensation, E-STATCOM and utility-scale storage like BESS. These models must represent the controls, protection and settings of the installed equipment. A generic converter model may be useful for an early study, but it cannot establish the response of the selected manufacturer’s equipment.
PSS®E and PSCAD answer different questions. PSS®E is used to study the facility’s response within the wider power system. PSCAD represents faster electrical transients and converter controls in more detail. Together, they allow engineers to examine demand changes, grid disturbances and interactions that a static load calculation would not reveal.
Merus Power has readily available simulation models for our compensators and BESS with strong experience in the domain:
- Own simulation team and simulations based on own hardware eliminating interface risks
- Merus has supplied first grid-forming BESS in the Nordics, including accepted simulations
- Many successful SJV processes with BESS with Fingrid
The purchase specification for equipment suppliers should include:
- Model delivery: the required PSS®E and PSCAD files, compatible software versions and delivery dates.
- Equipment settings: controls, current limits, protection and fault ride-through functions that match the supplied equipment.
- Validation and support: test results, model documentation, known limits and manufacturer support for the studies.
- Use and updates: the rights needed to submit models for compliance studies and updated models when equipment or settings change.
The equipment models are then connected to a model of the facility’s transformers, cables, loads and plant controls. This is necessary because a device that performs well on its own can behave differently when connected to the rest of the facility. Commissioning measurements provide the final check that the model represents the installed plant.
The relationship between cooling and computing also belongs in the model. If a cooling system disconnects or restarts after a disturbance, it changes electrical demand and may affect which computing loads can remain in service. Combining similar loads to simplify the model must not remove these dependencies.
Key grid connection requirements
For large demand connections like data centers, KJV2026 addresses reactive power exchange, changes in demand, recovery after faults and the ability to limit consumption. The below table summarizes why each matter and what the engineering focus. Meeting one requirement does not establish that the complete facility meets the others.
| CONNECTION DUTY | WHY IT MATTERS? | WHAT TO FOCUS ON? |
| Reactive power exchange | Cable capacitance, transformers and load power factor change reactive demand | Calculate reactive import and export across the load range |
| Power ramps and steps | Workload transitions can cause large changes in grid demand | Compare the load profile with the permitted steps and ramps |
| Cyclic power oscillations | Repeated AI cycles can excite power-system oscillations | Assess the load spectrum and residual oscillations with compensation |
| Post-fault demand recovery | UPS input demand can return more slowly than computing demand | Simulate grid import after voltage restoration using actual UPS behaviour |
| Demand limitation | Sustained grid-demand reduction needs energy or native load control | Check activation time, reduction targets and duration |
| Disturbance withstand and other duties | The facility must withstand specified faults and remain controllable | Verify fault ride-through, stability, protection and measurements with detailed models |
The 100 MW example data center
To understand grid connection requirements, this article uses the following data center electrical setup:
- The load allocation is 80 MW at the UPS inputs, 15 MW for cooling and 5 MW for auxiliaries.
- The facility connects at 110 kV through a 125 MVA main transformer.
- Later cases vary cable length, power factor and other inputs to show their effect on compensation. These are separate sizing cases, rather than a complete compliance study of one site.
Electrical configuration
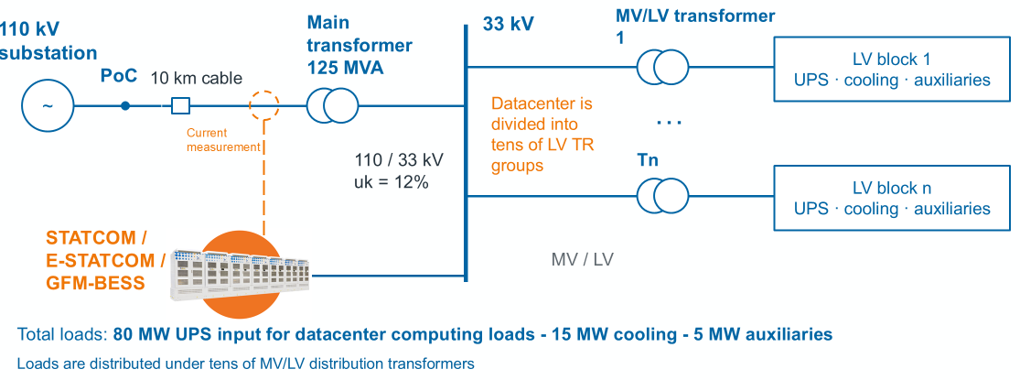
Figure 3. Example 100 MW facility: 110 kV connection, 125 MVA 110/33 kV main transformer and distributed LV load groups. The 80 MW allocation is UPS input, not net rack demand.
The electrical model and AI load profile draw on publicly available data center research:
- Brett Ross and Jim Follum, Electromagnetic Transient Modeling of Large Data Centers for Grid-Level Studies, Pacific Northwest National Laboratory, U.S. Department of Energy, December 2025.
- Brett Ross, Xue Lyu, Sameer Nekkalapu and Jim Follum, Data Center Model Library for Electromagnetic Transient Analysis (PSCAD), IEEE Dataport, 23 January 2026, doi:10.21227/ev1a-g183.
Load profile
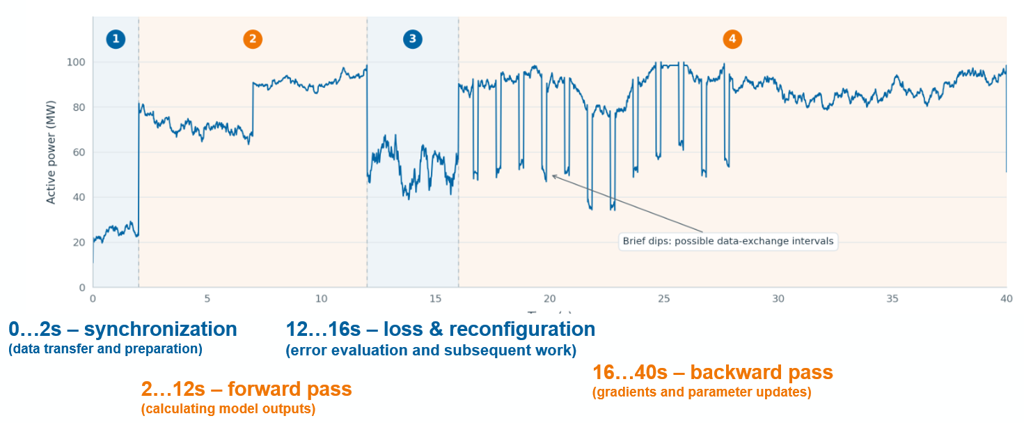
The 40-second trace is scaled to a 100 MW peak and represents the whole facility in the dynamic examples. This simplifies the relationship between computing, cooling and auxiliaries: they are not simulated as separate load profiles. For an actual project, the study must use the expected timing and variation of those loads.
The the next sections use these exemplary power and load profiles to illustrate what determines STATCOM, E-STATCOM and BESS dimensioning. The aim is to connect each requirement to the power, energy or response capability needed to meet it.
Requirement 1: Reactive power exchange and STATCOM sizing
Reactive power adds current in transformers and cables without delivering net energy to the load. In a data center, its level depends on the UPS inputs and cooling drives as well as the electrical network itself. Transformers add inductive demand, while cable capacitance produces capacitive charging. As a result, the facility may import reactive power at high load and export it at light load.
Fingrid’s reactive power allowances are expressed as upper and lower limits for import and export, rather than one fixed power factor target. Figure 4 shows how the example facility’s reactive exchange changes with load and how much compensation is needed to bring it inside those limits. Fingrid can also set limits for an individual connection to reflect regional network needs.
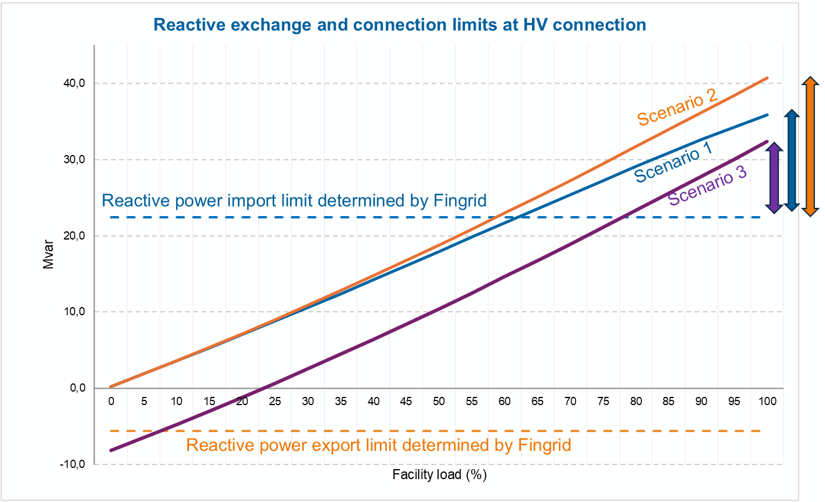
Figure 4. Reactive exchange over the facility load range. The dashed lines represent the illustrative import and export envelope. Compensation must bring each operating point within the agreed project envelope.
The three scenarios in figure 4 use 50 MV/LV transformers and a Displacement Power Factor (DPF) of 0.95 for cooling and auxiliary loads. Improving UPS power factor reduces inductive demand. A longer connection cable between HV substation and the local main transformer(s) offsets more of that demand at high load, but can create more capacitive export at light load. This explains why the compensation rating changes from about 10 to 20 MVAR between scenarios.
| Scenario | UPS DPF | Cable length to substation | Indicative compensation |
| 1 | 0.99 | 2.5 km | About 14 Mvar |
| 2 | 0.98 | 2.5 km | About 20 Mvar |
| 3 | 0.98 | 16 km | About 10 Mvar |
A STATCOM is well suited to this changing duty because it adjusts reactive output rapidly and continuously as the load varies. A fixed capacitor bank cannot follow those changes, and mechanically switched banks are not quick enough for rapid AI load swings. Exceeding the reactive power allowance can create substantial operating costs even when it does not by itself mean a breach of the technical grid code. For illustration, a constant 10 MVAR excess throughout a non-leap year would leave 8,160 billable hours after those exclusions. The resulting charges are EUR 120,000 for reactive power and EUR 408,000 for reactive energy, or EUR 528,000 per year before VAT. This could mean STATCOM payback time from 3-5 years.
Requirement 2: Fast load changes and active power smoothing
An AI training cycle moves between data preparation, forward computation, reconfiguration and backward computation. Because many processors can change activity together, the resulting facility demand can rise or fall quickly. An E-STATCOM or BESS can charge when demand falls and discharge when it rises, allowing grid import to change more gradually.
Sizing and design consequences for compensation:
- The largest instantaneous power swing determines the BESS / E-STATCOM power rating
- Power cycle intervals determine the needed energy capacity
- Power response must be within milliseconds
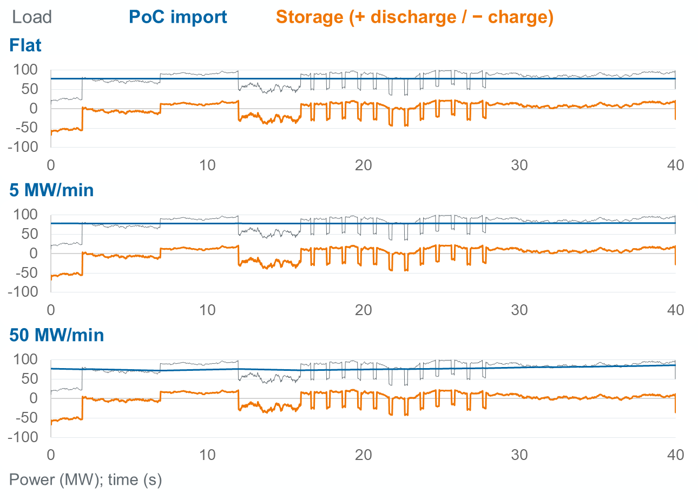
Figure 5. A 40-second AI load profile with three illustrative import-control policies. Grey is facility load, blue is PoC import, and orange is storage power. Positive storage power denotes discharge.
| IMPORT-CONTROL POLICY | PEAK ABSOLUTE STORAGE POWER | IDEAL USABLE AC ENERGY |
| Flat import | About 67 MW | About 48 kWh |
| 5 MW/min ramp | About 67 MW | About 46 kWh |
| 50 MW/min ramp | About 67 MW | About 36 kWh* |
* not to be used for dimensioning alone: applies to fast power swings only
In this profile, the largest requirement occurs at the start, when facility demand is low, but the grid-import target is already much higher. The storage must absorb the difference, producing a charging requirement of about 67 MW in all three cases. A faster permitted grid ramp reduces the energy that storage must absorb or supply but barely changes that initial power requirement. Flat import needs about 48 kWh of usable AC energy over the record, equivalent to roughly 2.6 seconds at 67 MW.
These figures describe the energy excursion of an ideal compensator over a short record. A physical storage needs additional installed capacity for losses, aging and the operating range kept available for charging and discharging. Its controller must also restore state of charge between cycles. The flat-import target uses the known record average, which a real controller would need to estimate or replace with another control strategy. The 5–50 MW/min values are assumed operating-point ramps; they are not limits applied to every millisecond of computing activity.
Requirement 3: Power oscillation and compensation response
Repeated changes in AI demand can cause oscillations in the power system, particularly if their timing interacts with grid or converter dynamics. These variations in active power occur below the 50 Hz grid frequency. They are different from current and voltage harmonics, which occur at multiples of 50 Hz. Such power oscillations amplify existing natural oscillations and can cause stability issues in the transmission network, including:
- Torsional resonance modes in rotating generator axes
- Protection relay tripping and equipment failure
- Converter instability
- These can lead to grid failures and loss of capacity
The oscillation example tests a specific converter and storage configuration with datacenter load.
- The device has a 75 MVA converter, up to 70 MW of charging or discharging, 20 Mvar reactive priority and 0.12 MWh gross storage (sizing here is not optimized considering other requirements, just exemplary for the simulation to prove that compliance can be achieved).
- The assumed control delay is 2 ms, followed by a 5 ms response lag.
- Storage starts at 50% state of charge, operates between 10% and 90%, and has 97% efficiency in each direction. These settings determine how closely it follows the required compensation.
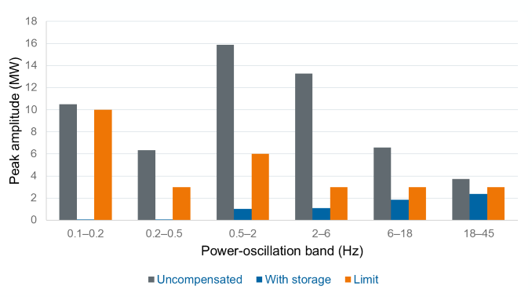
The below table summarizes the oscillation frequency distribution
| Power band (Hz) | % of rated MW | Absolute cap (MW) | At 100 MW | Window (s) |
| 0.01–0.025 | 20 | 40 | 20 | 300 |
| 0.025–0.05 | 20 | 40 | 20 | 160 |
| 0.05–0.1 | 20 | 40 | 20 | 80 |
| 0.1–0.2 | 10 | 20 | 10 | 40 |
| 0.2–0.5 | 3 | 6 | 3 | 20 |
| 0.5–2 | 6 | 12 | 6 | 10 |
| 2–6 | 3 | 6 | 3 | 2 |
| 6–18 | 3 | 6 | 3 | 1 |
| 18–45 | 3 | 6 | 3 | 0.5 |
Engineering and design consequences:
- Datacenter power profile needs a frequency sweep (FFT) and it needs to be simulated with a properly sized BESS or E-STATCOM to ensure compliance
- Grid-Forming BESS or E-STATCOM need to be capable of very fast response time
- Extremely fast communication architecture between the facility level master (power plant) controller and individual BESS/E-STATCOM converters
For a project developer, an important detail is that the same converter carries both the active power used to smooth the load and the reactive power used to support voltage. Its rating is expressed in MVA and must cover both functions when they are needed at the same time. A 70 MW active-power rating alone therefore does not describe the complete duty.
In this example, supplying 70 MW and 20 Mvar simultaneously requires at least √(70² + 20²), or 72.8 MVA, at nominal voltage before margins. This is why the study uses a 75 MVA converter. If more reactive support is required, less converter capacity may remain for active power unless the converter is sized accordingly.
The available output can also fall during a voltage dip, because the converter cannot increase its current without limits. The supplier therefore needs to confirm the simultaneous active and reactive output at the voltages the design must withstand, including which function takes priority if a current limit is reached. Grid-forming control can support the network, but that operating mode does not by itself guarantee the required power capacity or response.
Requirement 4: Sustained load steps and storage sizing
KVJ2026 sets the maximum step-wise change to be 50MW in sustained load changes which is potentially most important sizing criteria for the energy capacity, but this will depend on KVJ2026 interpretation.
For example:
- If demand rises immediately by 50 MW while grid import can rise at only 50 MW/min, storage initially supplies the full 50 MW. Its contribution falls to zero after 60 seconds.
- The triangular discharge duty is ½ × 50 MW × 60/3600 h = 0.417 MWh AC.
- At a slower 5 MW/min ramp, catch-up takes ten minutes and energy rises to 4.17 MWh. Initial storage power remains 50 MW.
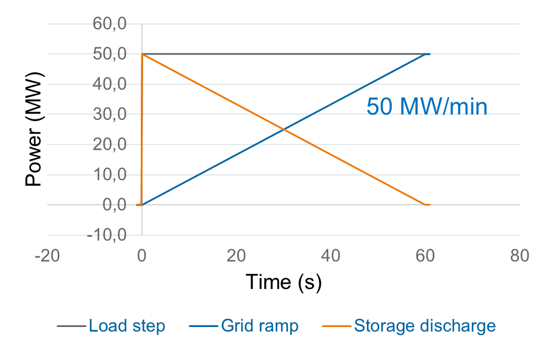
Figure 7. Incremental power above the original operating point for a 50 MW sustained step. The additional ramp applied to the step is an engineering assumption, not a claim that every allowed 50 MW step must be buffered.
Requirement 5: Post-fault demand recovery
If a network fault should happen, the UPS kicks in to protect datacenter computing loads and most of the load is effectively decoupled from the grid. The connection requirement concerns the demand seen by the grid after voltage returns, which may recover more slowly than the IT load itself. Storage charging can fill that temporary gap. In this example, native demand resumes at 20 MW after a 200 ms fault and takes four seconds to return to 100 MW. Charging lifts grid import to the required 90 MW recovery target while native demand catches up.
Engineering and design consequence:
- Sufficient power and energy capacity to start charging when voltage is restored
- In the simulated case, 70 MW of charging power and 85 kWh of energy if UPS switchover is assumed to be linear load increase
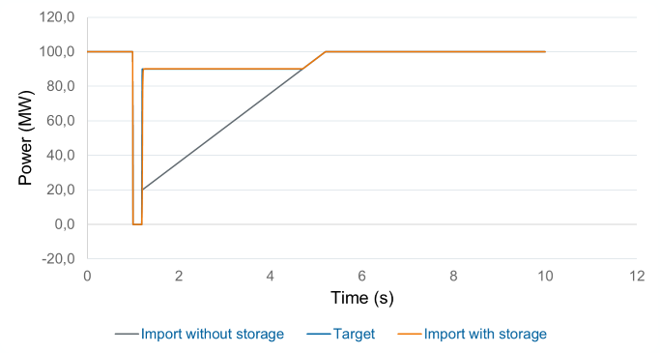
Figure 8. Charging support after voltage restoration. The recovery criterion is at least 90% of pre-fault demand within one second after voltage reaches 0.90 pu. The imposed-voltage example does not establish fault ride-through capability.
This duty requires about 70 MW of peak charging power, but only a short charging period. The storage gains 33.02 kWh on the DC side. If it starts at 50% state of charge and must remain below 90%, only 40% of its gross capacity is available to receive that energy. Dividing by 0.40 gives an energy-only gross requirement of 82.54 kWh, or about 85 kWh. This is a capacity calculation, not the AC energy absorbed. Charge acceptance, current limits and operating reserves can require a larger storage.
Requirement 6: Demand limitation and storage duration
During a power shortage, Fingrid (TSO) can require a large demand facility to reduce the power it takes from the grid. The response must start within one second, with at least a 30% reduction to the agreed target reached within at most 15 minutes. As they requirement considers entire power range, dimensioning should be done in accordance with maximum demand. A data center can meet that reduction through lower native consumption, battery discharge or on-site generation where permitted. The practical design question is how long each resource must maintain its contribution.
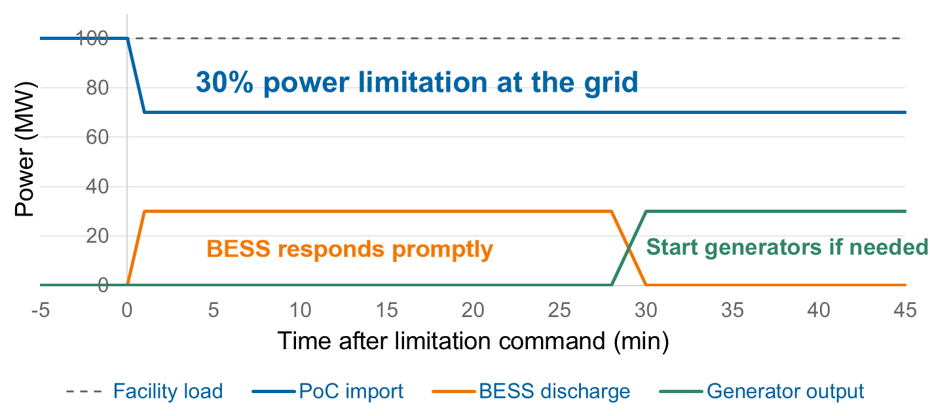
Figure 9. Conceptual handover: BESS initially supplies the reduction in grid import, with generation taking over if needed. The illustrated handover timing is a design choice; the chart is not a result for the 0.12 MWh short-duration device.
For example, if a 100 MW facility keeps consuming at the same rate while grid import falls to 70 MW, storage must provide the missing 30 MW. In an assumed 30-minute event, with a 0.5-second activation delay and a 30-second ramp, this requires 14.87 MWh of AC discharge. Lower grid-import targets increase both the discharge power and the energy required, as the table shows.
| REMAINING GRID IMPORT | STORAGE DISCHARGE | AC ENERGY OVER ASSUMED EVENT | GROSS ENERGY-ONLY ESTIMATE |
| 70 MW | 30 MW | 14.87 MWh | 38.33 MWh |
| 40 MW | 60 MW | 29.74 MWh | 76.65 MWh |
| 20 MW | 80 MW | 39.65 MWh | 102.20 MWh |
The gross capacities allow for 97% discharge efficiency and operation from 50% down to 10% state of charge. Only that 40-percentage-point range is available for the event, which explains why installed energy is much greater than the AC energy delivered. Aging and additional reserves increase the requirement further. The 30-minute duration and the 20 MW final-import target are study assumptions. Reducing native load or bringing generators online earlier would reduce the battery duty.
This also explains why the 0.12 MWh store used for oscillation screening cannot provide sustained demand limitation. In the separate device simulation, it runs out of available energy before reaching the first sustained target, and its 70 MW power rating is below the 80 MW needed for the third case. Fast response and long duration are separate capabilities, so both must be checked when one storage system is expected to perform several services.
Summary of design principles and sizing rules
Fulfilling KJV2026 requirement needs fast response, and energy capacity depends on strategy:
- Grid-Forming BESS or E-STATCOM is needed if the UPSs inside of the facility cannot smoothen the power fluctuations to meet the KVJ2026 requirement.
- Data center power fluctuation is very fast. This means the BESS or E-STATCOM used needs to have a particularly fast control and communication architecture such as Merus Power equipment.
- The range of 5 MW/min … 50 MW/min ramp rate does not materially affect compensation solution sizing
- The required power for power smoothing and other uses depends on how big the power swings in the AI datacenter are, but at the very least the same power as the IT load of the facility. Likely power rating is close to the power rating of the facility itself.
- The required energy for power smoothening is small according to the studied model but should be verified with the actual power profile of a given datacenter.
- Typical commercially available batteries with BESS far exceed the energy requirements in any of the example cases.
- If an E-STATCOM solution is built with supercapacitors, the energy capacity sizing is more precise work, and according to this study high capacities are needed for this technology (2-6 seconds), depending on which of the previous criteria gives the sizing maximum. This might make using batteries more commercially viable.
- As data centers are often built in phases, having modular solutions is beneficial. Align the reactive power compensation needs with building phases. Reserve enough medium voltage feeders for BESS and STATCOM. Choose a supplier who already has simulation model of the provided technology and earlier experience working with Fingrid such as Merus Power
Initial equipment sizes and space requirements
| PLANNING ITEM | EARLY HEURISTIC | MEANING FOR A 100 MW FACILITY |
| STATCOM reactive rating | About 0.15–0.40 Mvar per MW of maximum demand | About 15–40 Mvar; scenario examples range from 10–20 Mvar |
| BESS or E-STATCOM active power | About 70–80% of maximum facility MW | About 70–80 MW, checked in both charge and discharge |
| E-STATCOM energy | Around six seconds for the illustrated fast duty | 70 MW for six seconds corresponds to about 0.117 MWh before product-specific allowances |
| BESS duration | 30 minutes as an initial demand-limitation scenario | At 70 MW, 30 minutes is 35 MWh of delivered energy, before losses and reserve |
| STATCOM space reservation | About 10–15 m² per Mvar | A 20 Mvar allowance gives roughly 200–300 m² |
| BESS space reservation | About 20–30 m² per MWh | Use the selected installed MWh, then verify the site layout |
Comparing STATCOM, E-STATCOM and BESS
BESS can also provide reactive power and fast load smoothing when its converter, controls and batteries are specified for those duties
| STATCOM | E-STATCOM | BESS | |
| What it is | A converter providing reactive power compensation. | A STATCOM with a short-duration energy buffer. | Batteries connected through a power converter. |
| Main role | Control reactive power exchange and support voltage. | Add fast active power support to smooth brief load fluctuations. | Supply or absorb active power over longer periods. |
| Data center use | Reactive power and voltage control. | AI load smoothing and power oscillation damping. | Sustained demand reduction and peak shaving. |
| Key sizing quantities | Reactive power Mvar. | Active power MW, reactive power Mvar, and buffer energy in seconds. | Power MW, stored energy MWh (or required duration in hours). |
Part 2: Data Center Power Quality
Harmonics, power factor and unbalance
Inside the data center, power quality matters at the supply terminals of the UPS, cooling equipment and auxiliary loads. A strong high voltage connection can have good voltage quality while an internal low voltage bus has significant distortion. Transformers and cables add impedance between those points, and switching from grid to generator supply changes the source again. Internal power quality therefore needs its own assessment.
| CHALLENGE | WHAT IT MEANS? | PRACTICAL CONCERN |
| Harmonics | Distorted current and voltage from nonlinear loads | Additional heating and losses, equipment trips and resonance |
| Power factor | Proportion of active power to apparent power | Reduced capacity for active power transfer, extra losses in the system |
| Unbalance | Unequal loading or voltages across the phases | Uneven phase loading and possible overloading of neutral wires or thermal concerns |
Cooling drives, UPS converters and rack power supplies do not necessarily draw a smooth sinusoidal current. The resulting harmonic currents depend on equipment design and loading. Modern Active Front Ends (AFE) and power factor correction can reduce them substantially, so designers need harmonic spectra from the selected suppliers rather than one generic distortion figure to evaluate power quality inside the facility. Cooling drives are often an important source to assess, particularly when their rectifiers have limited harmonic mitigation. It is worthwhile to note that AFEs are typically more expensive option than lower efficiency, and use more space compared to for example six-pulse drives and Active Harmonic Filters.
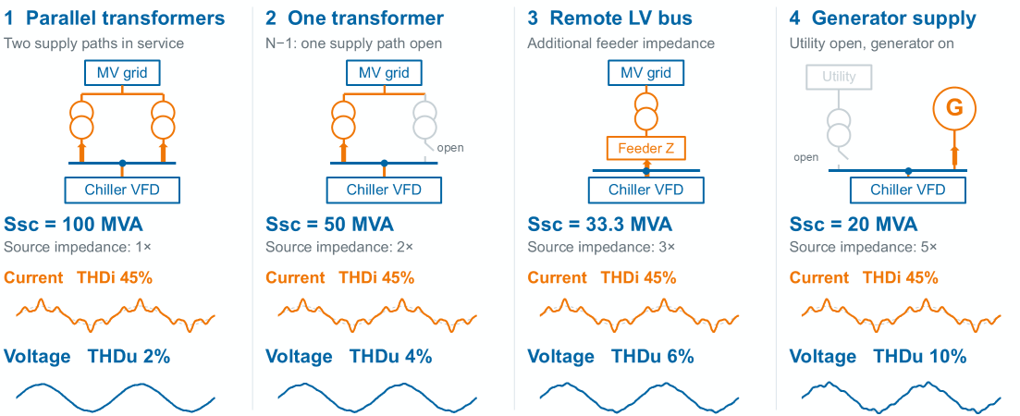
Figure 10. The same synthetic 45% current THD produces different voltage distortion as source impedance changes. The 2%, 4%, 6% and 10% values are illustrative sensitivity results, not measurements or compliance limits.
The same harmonic current can cause more voltage distortion on a weaker supply.
- A transformer, long feeder or generator can present more impedance to harmonic current, creating a larger harmonic voltage drop. Figure 10 holds current distortion constant to show this mechanism.
- This is why it is worthwhile to study the harmonic distortion and its effects in different UPS modes of supply, as the source impedance changes dramatically between the modes.
- A harmonic study must also include capacitances in the system, background distortion and resonance analysis. Fundamental-frequency fault level alone does not describe the network at every harmonic frequency.
How active harmonic filters reduce harmonics
An active harmonic filter measures the load current and injects a compensating current into the low voltage bus. This reduces the harmonic current that would otherwise flow through the upstream transformer and cables. Because the filter continually adjusts its output, it can follow changes in cooling demand and the mix of connected loads. Locating it at the transformer load group addresses the problem close to its source rather than relying only on voltage quality at the high voltage connection.
Local compensation at the low voltage bus
Reducing harmonic current can lower heating and voltage distortion in the distribution system. Merus A2 AHF can also compensate reactive current and load unbalance, but those functions use part of the same current rating. The filter must therefore be sized for the combination of functions expected to operate together. Local compensation improves the internal power quality in the facility, but it cannot correct every voltage disturbance originating from the upstream grid.
UPS bypass and generator operation
The harmonic current path also changes with UPS operation. During normal double conversion, the UPS partly separates rack harmonics from the upstream supply. Static or maintenance bypass connects that load more directly, so upstream equipment can see a different harmonic spectrum. Generator operation changes the source impedance as well. The filter and its current measurements should therefore be checked for grid supply, bypass and generator operation, including the loss of one supply path.
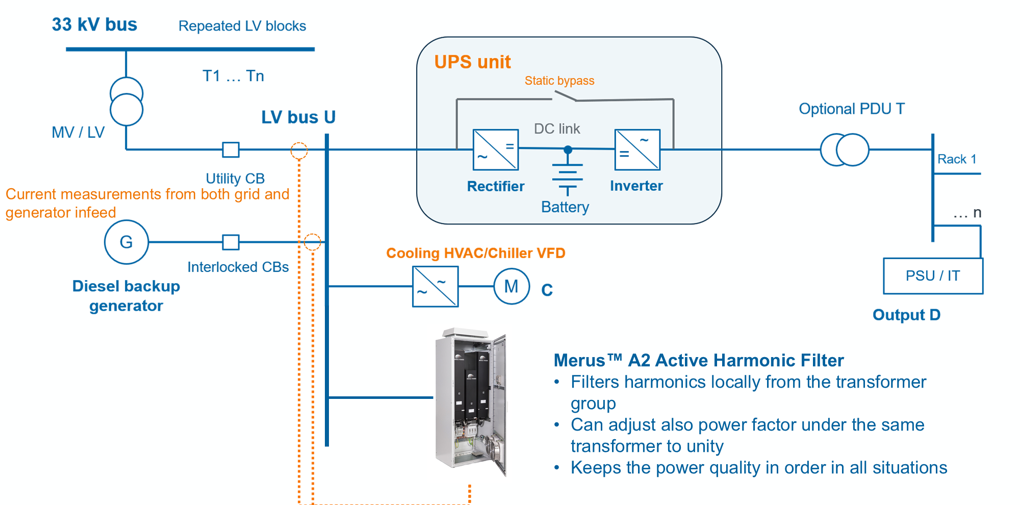
Figure 11. Local AHF connection at the LV bus, with current measurements from utility and generator infeeds. Reactive correction, harmonic suppression and operation under different supplies remain subject to the selected rating and verified control behavior.
An active filter can adjust its compensation as emissions change, which is useful where load and supply conditions vary. Its controls still need to account for network resonance. A resonance-damping function can be included where the study identifies a risk, with settings checked against the network. Installing a filter on a UPS inverter output is a separate case and requires approval from the UPS manufacturer.
AHF sizing example and rule of thumb
An AHF is rated in amperes at its connection voltage, so facility demand in MW alone cannot determine its size. The starting point is the harmonic current that must be removed at each transformer group. Designers then check the remaining individual harmonics and the resulting voltage distortion under grid and generator supply. The following example shows how a first estimate can be made before the detailed harmonic study.
| Illustrative input | Screening assumption |
| Facility demand and distribution | 100 MW; 50 groups with nominal 2 MVA transformers |
| Cooling and auxiliary share | 20% of demand |
| UPS input current THD in normal operation | 3% |
| Rack current THD exposed in bypass | 5% |
| Cooling and auxiliary current THD | 45% |
| Selected bus current THD target | 3% |
The screening calculation suggests 300 A of AHF per transformer group.
- At 400 V, a 2 MVA transformer has a rated current of approximately 2,887 A.
- Assume the harmonic contributions add in proportion to load shares, with aligned phase angles. In UPS bypass, combined current distortion is 0.8 × 5% + 0.2 × 45% = 13%.
- Reducing that estimate to a 3% target requires compensation of about 10% of the reference current: 0.10 × 2,887 A ≈ 289 A.
- An initial 300 A candidate could be supplied as one cabinet or two 150 A modules.
For this example, the early allowance is about 0.15 A per kVA at 400 V.
- The ratio depends on the assumed load mix and 3% target. It changes with voltage, load level and harmonic spectrum; actual harmonic phase angles also affect how currents combine.
- The calculation uses transformer rated current as a reference. It does not verify transformer loading or replace a harmonic load-flow study.
From estimate to final filter rating
The final rating should use supplier harmonic spectra and phase angles for the selected equipment. It must cover the demanding operating modes, including UPS bypass and generator supply, as well as any reactive-power or unbalance compensation assigned to the filter. Derating, redundancy and future load growth also affect the installed capacity. Once local power factor correction is included, recalculate reactive exchange at the grid connection so the same compensation is not specified twice.
The 3% current THD target in this example is a design assumption, not a universal limit. Voltage THD describes voltage distortion; current THDi relates harmonic current to the fundamental current at that operating point; and Total Demand Distortion (TDD) uses maximum demand current as its reference.
Typical standards to address harmonics are IEC 61000-2-4:2024, EN50160 and IEEE 519-2022. When interpreting the limits set by these standards, it is important to understand at which point they are intended to be applied.
How Merus Power supports data center projects
Merus Power supports the project from electrical studies to operation.
- We assess how load profiles, reactive power, fault recovery and power oscillations affect the connection.
- We compare the facility’s own controls with additional STATCOM, E-STATCOM or BESS support, identifying the required capability before equipment is selected. When we choose the sizing based on our solutions, it works.
- We support PSS®E and PSCAD studies within the project’s agreed responsibilities and provide models for our equipment. Other manufacturers supply their device models.
- Delivery can include modular compensation and storage systems, commissioning, maintenance and comprehensive life-cycle services with availability guarantees.
- For internal power quality, we assess local filtering needs and supply AHF solutions, connecting the study to equipment that can be specified, installed and verified.
Any questions? We’re happy to help!


Lasse Hietikko
Sales Manager, Power Quality,
Data Centers & Renewables

Watch ‘Data Center Grid Connection and Power Quality’ Webinar
Fill the form and we’ll email you the webinar recording summarizing the content of this guide. Webinar Recorded in 11/2026. By submitting the form you agree with Merus’ privacy notice.
Article sources and technical basis
Fingrid KJV2026 status and consultation documents
Fingrid technical requirements for large demand facilities